For as long as digital marketing has been around, advertisers have chased various metrics to show campaign effectiveness. Digital advertising is dissected endlessly, simply because it can be. The days of traditional media reports showing GRPs based on Nielsen ratings being sufficient to spend six figures seems so odd now.
Google Analytics gives businesses valuable insights into where their visitors are coming from, and what they do while on the site. It’s easy to see which traffic is valuable, versus those sources that are simply junk, and wish it would just go away.
But how can you measure effectiveness in a quantifiable way from a medium that isn’t intended to deliver a click from an intent driven user? Digital marketing is very results oriented – how many clicks did it get? How many leads? Video campaigns, whether placed in online mediums, or traditional cannot be measured the same way.
But Why?
Think of video measurement in a way of how you, yourself consumes video. How often do you see an ad on YouTube before you get to the video you want to see, and say, “oh, forget what I wanted to see… I gotta get me some of that!” If you said anything other than, “never, I can’t wait for the skip button,” you’re either lying to yourself, or you’re among an exceedingly rare breed.
Similarly, video campaigns placed on cable, broadcast, or connected TVs have no opportunity to click through, so there is no direct connection from the video view to what people eventually do on your site. That certainly does not mean that these campaigns are bad because you cannot directly measure results in Google Analytics. Before you consider how to measure success, think about and understand how people typically consume video. Include your own viewing habits, and then determine what your barometer of success is.
The Analytical Methods
The majority of clicks from video views are what we would call, “accidental.” Someone was playing a game on their phone, and an ad popped up in the middle of it, and they clicked. Someone missed the “skip” button. It happens.
There are strong correlations between video campaigns, and direct traffic, or organic branded traffic going to your site. Though people typically don’t leave their intended entertainment for the sake of a product in an ad, they do go there when they’re ready, assuming they remembered your commercial for one reason or another.
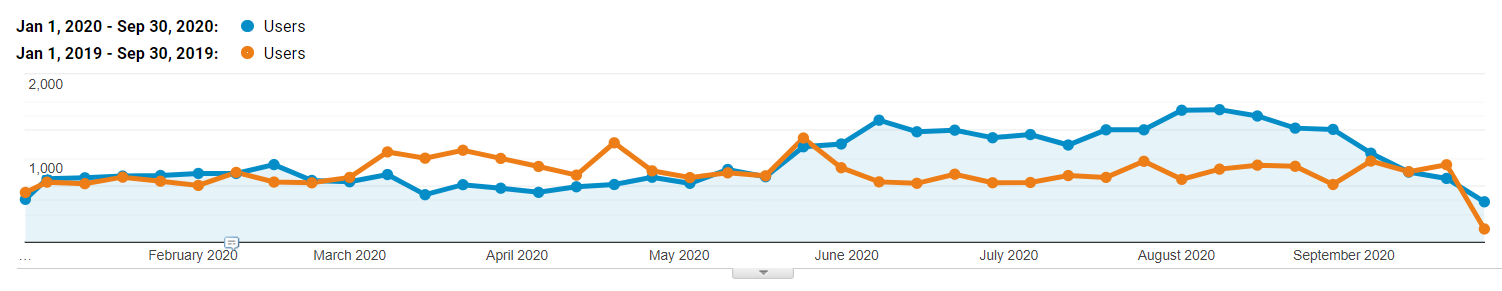
A live example is with an auto dealer we worked with since the COVID-19 pandemic saw a drastic increase in direct users, as well as organic branded search terms from May – August, compared to the year prior. We ran a branded video campaign starting in May, and ending in August. The other difference from the year prior was a 28% decrease in budget. They spent less money, and received more high quality brand search visitors, and people typing in their website address, leading to record sales and profitability, all during a global pandemic.
Using the Metrics You’re Given
Any video platform worth using provides various performance metrics that can help you understand how people are interacting with your video, and how engaged they are with it. One common one is view rate. This is typically a measurement of how many viewers saw your entire ad. Typically, as your cost per thousand impressions (CPM) increases, so does your view rate. Commonly, higher CPMs indicate better quality placements, whether it’s on a connected TV, or channel that has more engaged users.
Where your ad’s effectiveness can come into play is that the ad quality can help give you an outsized view rate compared to the CPM on some platforms. YouTube, especially, rewards quality content. If your ad shows quality view rates and engagement, you can typically see a lower CPM comparatively. Additionally, having higher view rates indicates a certain level of engagement, where your ad is viewed, and not skipped as frequently.
View rates tend to vary based on device. Connected TV is usually 98% plus, whereas mobile can fall somewhere in the 40% – 60% range. Consider your view rates against the devices used, what your baseline average is, and improve from there.
Additionally, you can look at your most frequent placements, and see if any outliers exist. Some outliers may consist of children’s channels, where it would have a high view rate, simply because a young child is continually watching the same programming, and your ads keep coming up for them to watch. Other outliers could be certain channels where the view rate is especially low, indicating some kind of problem with the site, or low relevance. In either case, those placements should be removed, and keep only those that are providing the desired results.
The Social Test
I like to test video campaigns on social media before running it widespread on other platforms. Facebook provides an excellent unfiltered focus group. You can easily see immediate reactions, the sentiment of how people respond to it, and better yet, it’s wide open to the general public to give you unbiased, unfiltered responses.
A perfect example of campaign testing on Facebook was a campaign that another auto dealership ran during the early stages of the COVID-19. They wanted to run a dual message of essential workers getting a free oil change and disinfectant service, and also anyone could get a $500 bonus toward the purchase of a new vehicle with a test drive.
We advised against the $500 bonus for a test drive because they were requiring people to go to the dealership during a period of time where the state was in a “shelter in place order,” but automotive dealerships remained open as essential businesses. The dealership wanted to proceed despite the concerns.
The feedback came swift, and was quite polarizing. While people responded positively in great numbers regarding the free oil change and disinfectant services for essential workers, a larger number responded with colorful language in opposition to the, “bribe to test drive,” as it became called. The fortunate thing is that these polarizing campaigns were tested for a few hundreds of dollars on Facebook to provide the substantiation needed for the dealership to not advertise the $500 test drive bonus across many other mediums, at a cost of tens of thousands of dollars.
Final Thoughts
Compared to some other digital marketing strategies, success is more open to interpretation for video campaigns. There is far more information available now than the purely traditional media days. A lot of it is clutter that can be used to spin performance in a certain way that can make something look better than it actually is.
For the direct metrics provided to you, pay particular attention to view rates and CPM, and how they correlate. The goal is to get a higher view rate for a lower CPM. There are limits to what you can accomplish – don’t expect a 75% view rate for a 30-second spot with a $10 CPM. You can always get incremental improvements, and see how certain campaigns compare to others, and it can be an indicator of how well people are responding to it.
Indirect metrics to follow are the number of branded searches and direct visits you get from the geographic areas you are targeting with your video campaign. Setup a new segment in Google Analytics to view user behavior of where you target your video compared to your site as a whole. Campaigns that resonate properly with the public start to show increases in these behaviors within a couple of weeks. This is a hallmark of a successful campaign generating leads or sales on your site.
Test. Test. Test. If you have a few campaign ideas for the future, run a test in Facebook ads and see how well it performs as a test there. You still get the benefit of advertising with Facebook, but it is also a great litmus test before you run your campaign in full-scale across several mediums.
Video is typically not a direct lead generating source, but it can certainly help open up the funnel toward more near-term sales. Take advantage of it, and listen to what your audience says is working.